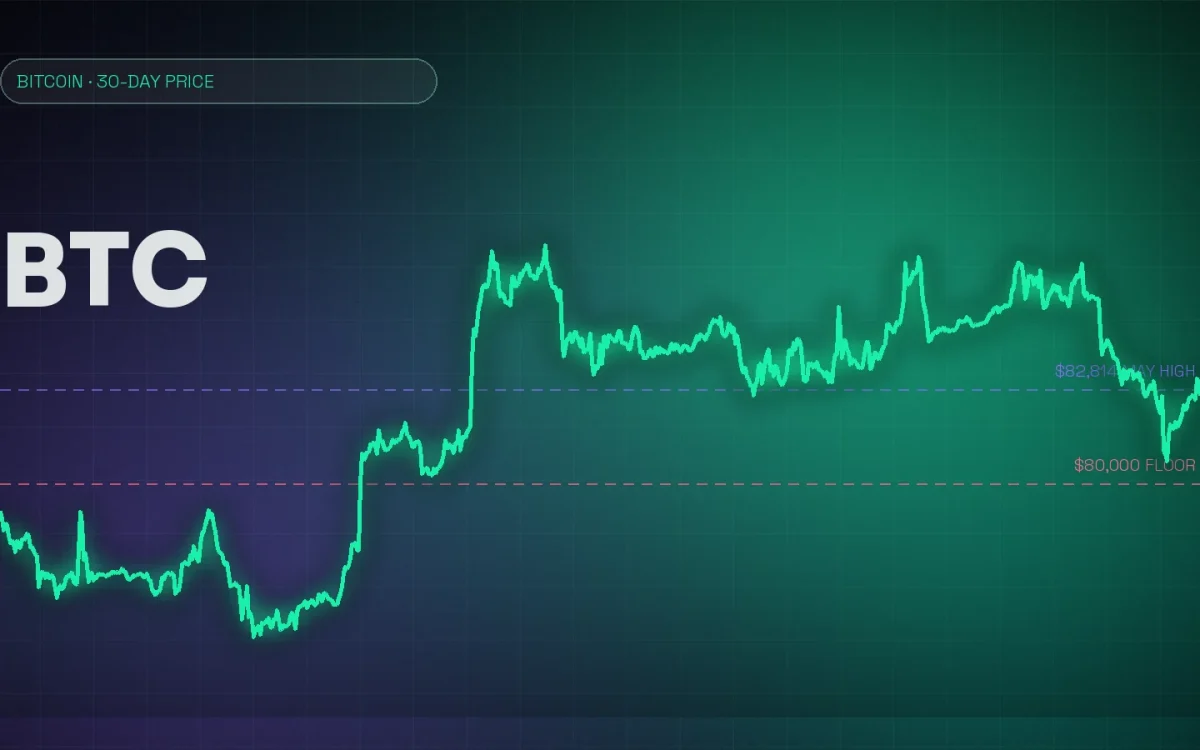
Bitcoin is trading around $82,600 on Friday after briefly falling to about $80,300 on Thursday, its lowest level in roughly a month. The bounce came after President Donald Trump said the U.S. would not strike Iran before the Nov. 3 midterm elections, but spot bitcoin ETFs are still losing money and the market is heading into the anniversary of the Oct. 10, 2025 flash crash.
What happened
According to CoinGecko data at 13:40 UTC on Oct. 9, bitcoin was changing hands at $82,614, up 0.7% over 24 hours and down 4% over seven days. Its 24-hour range ran from $80,427 to $83,398.
The selloff that pushed the price toward $80,000 had several drivers at once. Oil and bond yields climbed on fears of a U.S.–Iran conflict, with the 10-year Treasury yield reaching levels last seen in the early 2000s. About $1.19 billion of leveraged crypto positions were liquidated on Thursday, CoinDesk reported. The recovery started after Trump’s post on Truth Social ruling out a strike before the midterms, and Brent crude eased to around $103 a barrel on Friday.
The rebound has been more cautious than the drop. CoinDesk, citing Coinalyze data, said bitcoin futures open interest slipped 1.9% over 24 hours to $27.1 billion and barely moved while the price recovered. In plain terms, traders did not rush back in with new leveraged bets. That cuts both ways. There is less fuel for a squeeze higher, but also fewer overextended longs waiting to be flushed out.
The ETF picture has turned
The biggest change this week is in the U.S. spot bitcoin ETFs. They took in $321.6 million over the first four trading days of October, according to Farside Investors data cited by Cointelegraph. Then the flows reversed:
- Wednesday, Oct. 7: $484.9 million of net outflows, the largest single day since June 25. BlackRock’s IBIT led with $207.7 million, followed by Fidelity’s FBTC ($105.1 million) and ARK 21Shares’ ARKB ($101.7 million).
- Thursday, Oct. 8: another $244.1 million left the funds.
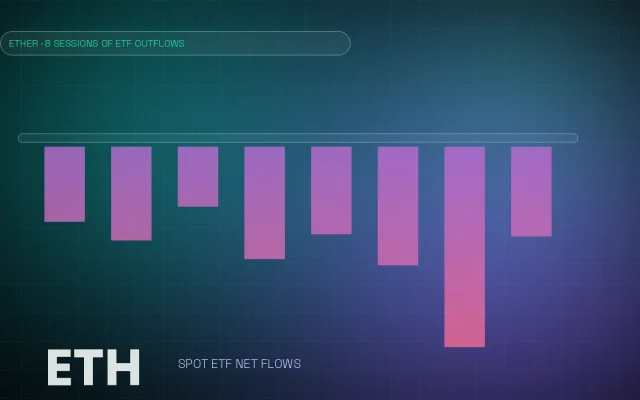
That is roughly $729 million in two sessions, and it leaves the bitcoin ETFs about $407 million in the red for October so far. Ether ETFs have done worse, with eight straight days of outflows. XRP funds were the only U.S. crypto ETF group with net inflows on Thursday, at about $8 million, according to SoSoValue data reported by CoinDesk.
Our read: two heavy days of outflows don’t make a trend on their own. But the funds had just put together a three-week run of inflows while bitcoin climbed from the mid-$70,000s to near $87,000 in late September. If that demand pauses, the market loses its most reliable buyer.
Why it matters
Sentiment has cooled fast. The Crypto Fear & Greed Index from Alternative.me dropped from 71 (“Greed”) on Wednesday to 59 on Friday. That is still above neutral, so this is not a panic. It does show how quickly confidence left after bitcoin failed to hold above $85,000.
The timing also matters. On Oct. 10, 2025, bitcoin fell from about $122,000 to near $105,000 within hours, triggering more than $19 billion in liquidations, the largest one-day wipeout in crypto history. Anniversaries don’t move markets by themselves. But thin weekend liquidity, rising open interest earlier in the week and plenty of traders who remember last year make for a jumpy setup.
For perspective, bitcoin’s record high on CoinGecko is $126,080, set on Oct. 6, 2025. At today’s price the market sits about 34% below that peak, even after a 4.5% gain over the past 30 days.
Key bitcoin price levels to watch
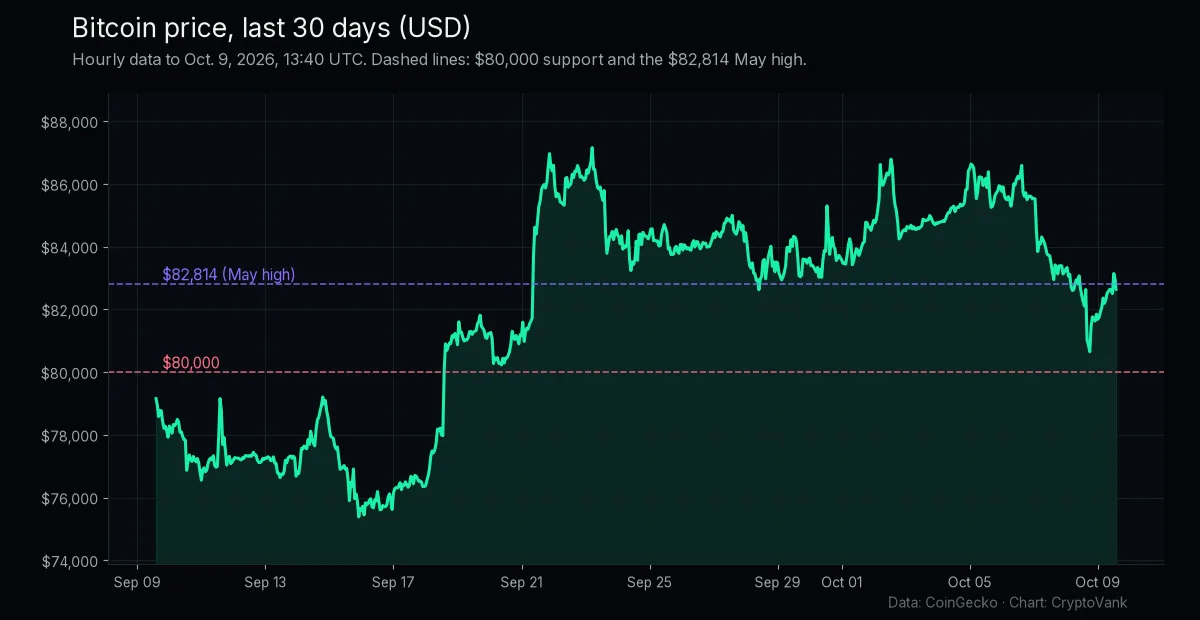
The chart above shows why traders care so much about the low $80,000s.
- $82,814: the May high. CoinDesk and IG both flag it as the level bitcoin broke above in September and then lost on Thursday. Reclaiming it would turn it back into support. A failed retest would be a bearish sign in classic technical terms.
- $80,000 to $80,300: this week’s low and the psychological floor. IG describes it as the breakout zone of September’s rally. A sustained break below it would suggest that rally has failed.
- $77,200: an on-chain support level named by Vikram Subburaj, CEO of the Giottus exchange, in comments to CoinDesk.
- $87,000 to $87,400: the September high and the top of the recent range. Getting back there would probably need ETF inflows to return.
What to watch next
- Daily ETF flows. The Farside and SoSoValue numbers published after each U.S. session are the cleanest read on institutional demand right now.
- U.S. September CPI on Wednesday, Oct. 14. The Bureau of Labor Statistics releases the report at 8:30 a.m. ET. A hot number would add to the pressure on yields, which has been one of bitcoin’s main problems this week.
- Oil and Iran headlines. Friday’s bounce rests on one statement. Any reversal in that story would likely hit risk assets again.
- The weekly close. Several analysts are watching whether bitcoin can close the week above $82,500.
FAQ
Why did bitcoin fall to $80,000 this week?
A mix of rising oil prices and Treasury yields on U.S.–Iran tensions, heavy ETF outflows and about $1.19 billion in liquidations on Thursday pushed bitcoin to around $80,300.
Are bitcoin ETFs still buying?
Not this week. U.S. spot bitcoin ETFs saw about $729 million in net outflows on Oct. 7 and 8, leaving them roughly $407 million negative for October.
What happened on Oct. 10, 2025?
Bitcoin dropped from about $122,000 to near $105,000 in a matter of hours, and more than $19 billion of leveraged positions were liquidated across the crypto market. It was the largest liquidation event on record.
Sources
- CoinDesk: >Bitcoin steadies near $82,500 after Trump rules out Iran strike before midterms
- CoinDesk: >Live updates: XRP ETFs the only crypto funds with inflows Thursday
- CoinDesk: >Bitcoin rebounds to $82,000 as Trump rules out Iran strikes
- Cointelegraph: >US Bitcoin ETFs shed $485M in biggest daily outflow since June
- IG: >Bitcoin outlook: ETF outflows, yields and $80K support
- CoinCodex: >Bitcoin price ahead of the Oct. 10 flash-crash anniversary
- U.S. Bureau of Labor Statistics: >CPI release schedule
- Price data: >CoinGecko; sentiment: >Alternative.me Fear & Greed Index
This article is for information only and is not financial advice. Crypto assets are volatile; do your own research.