
Quick answer: An ETH short squeeze lifted ether to about $2,562 at 07:55 UTC on Oct. 12, 2026, up 2.5% in 24 hours, per CoinGecko. CoinGlass data showed $38.17 million of ETH shorts liquidated, yet U.S. spot ether ETFs have now posted nine straight days of outflows.
An ETH short squeeze pushed ether back above $2,550 on Monday, Oct. 12, 2026, as traders betting on lower prices were forced to buy back. Ether traded at $2,562 at 07:55 UTC, up 2.5% in 24 hours, per CoinGecko, but U.S. spot ether funds have not yet joined the rally.
What happened in the ETH short squeeze?
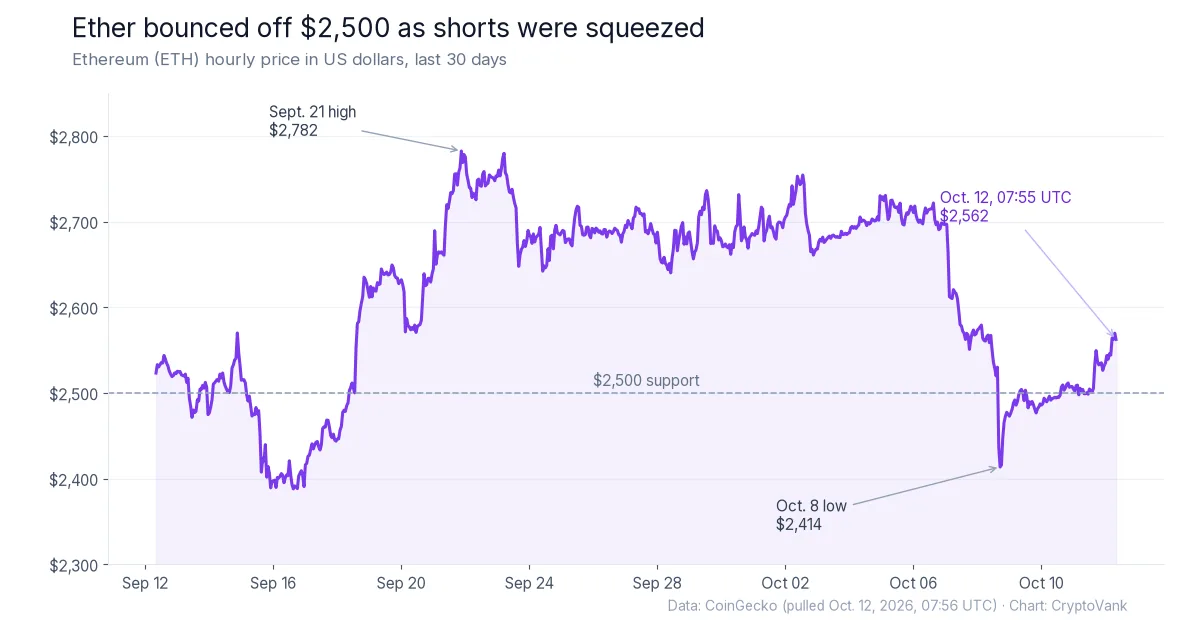
The move started late on Sunday, Oct. 11. Ether had been stuck near $2,500 for two days. Then it jumped to about $2,549 within a few hours, based on CoinGecko’s hourly data. After a short pause, it pushed to a 24-hour high of $2,572 early on Monday.
As a result, the climb caught bearish traders off guard. CoinGlass data cited by The Crypto Times showed $48.25 million of ETH positions liquidated in the 24 hours to 05:54 UTC. Shorts made up $38.17 million, or 79.1%, while longs lost $10.07 million. Ether therefore topped the liquidation table, just ahead of bitcoin at $46.80 million.
An earlier CoinGlass snapshot, carried by KuCoin News, told the same story. It showed $26.57 million of ETH shorts liquidated against $9.43 million of longs. Across the whole market, shorts lost $115 million out of $167 million.
Why the short squeeze matters for ether
A liquidated short is a forced buy order. The exchange closes the bet by buying ETH at market, which adds fuel to a rally. However, that buying stops once the weak shorts are gone.
Scale also matters here, though. CoinGecko put ether’s 24-hour trading volume near $10.5 billion. Next to that, $38 million of forced buying is small. In other words, the squeeze likely sped up the move, but it did not create it alone.
The wider market helped too. Bitcoin held above $84,000 as oil prices eased, CoinDesk reported. Meanwhile, ether outpaced it slightly. The ETH/BTC ratio stood at 0.0305 on CoinGecko, so ether gained some ground against the market leader.
ETF outflows cloud the rebound
The weak spot is fund demand. U.S. spot ether ETFs shed $542.1 million in the week to Oct. 9, their worst week since January, per The Block, citing SoSoValue. BlackRock’s ETHA alone lost $477.0 million.
Farside Investors data show the same trend. Ether funds have seen nine straight sessions of outflows since Sept. 29, worth about $697 million. On Friday, Oct. 9, another $56.1 million left, all of it from ETHA. We tracked the start of this streak in our report on ether’s 9% drop and ETF outflows.
For now, the rebound rests on derivatives and broad risk appetite, not on fresh fund buying. For a bounce to last, that usually needs to change.
Key ETH price data and context
Here is where ether stands after the squeeze, based on CoinGecko data at 07:55 UTC:
| Metric | Value |
|---|---|
| ETH price | $2,562 |
| 24-hour change | +2.5% |
| 7-day change | -6.0% |
| 30-day high (Sept. 21) | $2,782 |
| 7-day low (Oct. 8) | $2,414 |
| All-time high (Aug. 24, 2025) | $4,946 |
| Distance from all-time high | -48% |
Overall, the bounce has so far recovered only part of last week’s slide. Ether still trades about $220 below its Sept. 21 high and well below its record. Still, dips below $2,500 since Oct. 9 have stayed shallow, with the lowest hourly print near $2,477. That gives buyers a clear line to defend.
For a broader view of how fund flows move prices, see our guide to Bitcoin ETF flows explained and our report on October crypto ETF outflows.
What to watch next for ETH
First, watch Monday’s ETF flow data. A first day of inflows would end the nine-day streak and back up the price move. Another outflow would suggest the squeeze is running ahead of real demand.
Second, the macro calendar is busy. The U.S. consumer price index (CPI) report for September is due on Wednesday, Oct. 14. CoinDesk called it the market’s next major catalyst. The Federal Reserve then meets on Oct. 27 and 28.
Third, watch the price levels. The 24-hour high near $2,572 is the first hurdle. Above it, the zone near $2,700, where ether traded before the Oct. 7 sell-off began, comes into view. On the downside, a close back below $2,500 would undo the squeeze. The Oct. 8 low of $2,414 would then be the next test.
Finally, check funding rates on perpetual futures. If they turn sharply positive, new long leverage is building. That would set up the opposite risk: a long squeeze.
ETH short squeeze FAQ
What caused the ETH short squeeze on Oct. 12, 2026?
Ether climbed from about $2,500 late on Oct. 11 to above $2,560 on Oct. 12. That rise forced exchanges to close bearish positions, and CoinGlass data showed $38.17 million of ETH shorts liquidated in 24 hours.
Is the ether rebound backed by ETF buying?
Not yet. U.S. spot ether ETFs posted nine straight days of outflows through Oct. 9, worth about $697 million, per Farside Investors and SoSoValue data reported by The Block.
What ETH price levels matter now?
Traders are watching the 24-hour high near $2,572 and the $2,700 area above it. On the downside, $2,500 is the key support, followed by the Oct. 8 low near $2,414, based on CoinGecko data.
Not financial advice. This article is for information only. Crypto prices are volatile and leveraged trading can lose money fast. Always do your own research (DYOR).
Sources
- CoinGecko: Ethereum price and market data
- The Crypto Times: Ethereum price jumps above $2,500 as $48 million ETH gets liquidated
- KuCoin News: $167 million in liquidations across crypto markets in 24 hours
- CoinGlass: ETH liquidation data
- CoinDesk: Bitcoin shrugs off ETF outflows to trade above $84,000 as oil falls
- The Block: Ether ETFs extend outflow streak to nine days
- Farside Investors: Ethereum ETF flow data